
Advertisement
-
Published Date
February 16, 2023This ad was originally published on this date and may contain an offer that is no longer valid. To learn more about this business and its most recent offers, click here.
Ad Text
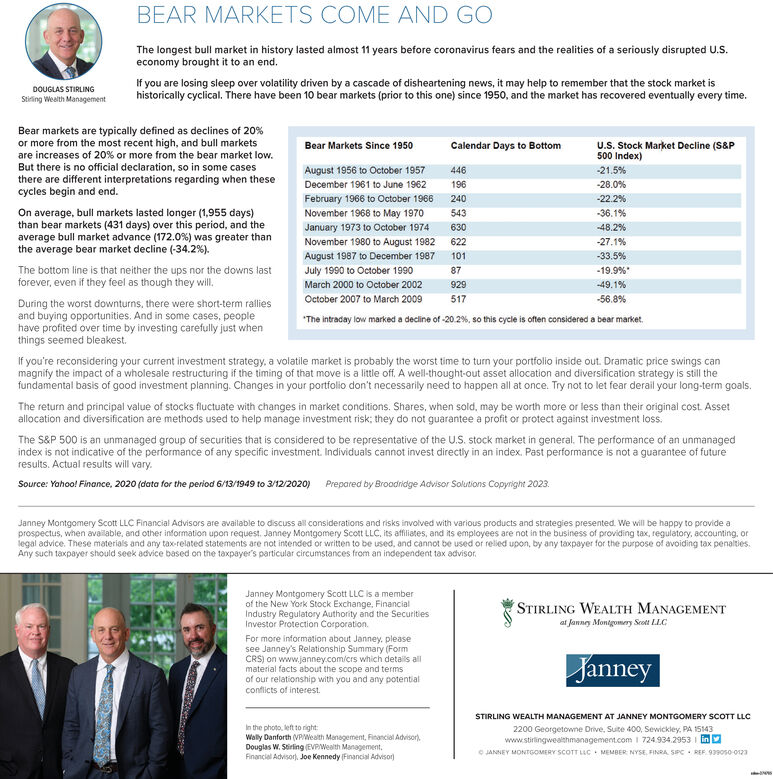
DOUGLAS STIRLING Stirling Wealth Management BEAR MARKETS COME AND GO The longest bull market in history lasted almost 11 years before coronavirus fears and the realities of a seriously disrupted U.S. economy brought it to an end. If you are losing sleep over volatility driven by a cascade of disheartening news, it may help to remember that the stock market is historically cyclical. There have been 10 bear markets (prior to this one) since 1950, and the market has recovered eventually every time. Bear markets are typically defined as declines of 20% or more from the most recent high, and bull markets are increases of 20% or more from the bear market low. But there is no official declaration, so in some cases there are different interpretations regarding when these cycles begin and end. On average, bull markets lasted longer (1,955 days) than bear markets (431 days) over this period, and the average bull market advance (172.0%) was greater than the average bear market decline (-34.2%). The bottom line is that neither the ups nor the downs last forever, even if they feel as though they will. During the worst downturns, there were short-term rallies and buying opportunities. And in some cases, people have profited over time by investing carefully just when things seemed bleakest. Bear Markets Since 1950 August 1956 to October 1957 December 1961 to June 1962 February 1966 to October 1966 November 1968 to May 1970 January 1973 to October 1974 November 1980 to August 1982 August 1987 to December 1987 July 1990 to October 1990 March 2000 to October 2002 October 2007 to March 2009 87 929 517 "The intraday low marked a decline of -20.2%, so this cycle is often considered a bear market. Calendar Days to Bottom 446 196 240 543 630 622 101 If you're reconsidering your current investment strategy, a volatile market is probably the worst time to turn your portfolio inside out. Dramatic price swings can magnify the impact of a wholesale restructuring if the timing of that move is a little off. A well-thought-out asset allocation and diversification strategy is still the fundamental basis of good investment planning. Changes in your portfolio don't necessarily need to happen all at once. Try not to let fear derail your long-term goals. Janney Montgomery Scott LLC is a memberi of the New York Stock Exchange, Financial Industry Regulatory Authority and the Securities Investor Protection Corporation. U.S. Stock Market Decline (S&P 500 Index) The return and principal value of stocks fluctuate with changes in market conditions. Shares, when sold, may be worth more or less than their original cost. Asset allocation and diversification are methods used to help manage investment risk; they do not guarantee a profit or protect against investment loss. For more information about Janney, please see Janney's Relationship Summary (Form CRS) on www.janney.com/crs which details all material facts about the scope and terms of our relationship with you and any potential conflicts of interest. -21.5% -28.0% -22.2% -36.1% -48.2% -27.1% -33.5% -19.9%* -49.1% -56.8% The S&P 500 is an unmanaged group of securities that is considered to be representative of the U.S. stock market in general. The performance of an unmanaged index is not indicative of the performance of any specific investment. Individuals cannot invest directly in an index. Past performance is not a guarantee of future results. Actual results will vary. Source: Yahoo! Finance, 2020 (data for the period 6/13/1949 to 3/12/2020) Prepared by Broadridge Advisor Solutions Copyright 2023. In the photo, left to right: Wally Danforth (VP/Wealth Management, Financial Advisor), Douglas W. Stirling (EVP/Wealth Management. Financial Advisor), Joe Kennedy (Financial Advisor) Janney Montgomery Scott LLC Financial Advisors are available to discuss all considerations and risks involved with various products and strategies presented. We will be happy to provide a prospectus, when available, and other information upon request. Janney Montgomery Scott LLC, its affiliates, and its employees are not in the business of providing tax, regulatory, accounting, or legal advice. These materials and any tax-related statements are not intended or written to be used, and cannot be used or relied upon, by any taxpayer for the purpose of avoiding tax penalties. Any such taxpayer should seek advice based on the taxpayer's particular circumstances from an independent tax advisor. STIRLING WEALTH MANAGEMENT at Janney Montgomery Scott LLC Janney STIRLING WEALTH MANAGEMENT AT JANNEY MONTGOMERY SCOTT LLC 2200 Georgetowne Drive, Suite 400, Sewickley, PA 15143 www.stirlingwealthmanagement.com 1 724.934.2953 in JANNEY MONTGOMERY SCOTT LLC MEMBER NYSE. FINRA SIPC REF 939050-0123 H DOUGLAS STIRLING Stirling Wealth Management BEAR MARKETS COME AND GO The longest bull market in history lasted almost 11 years before coronavirus fears and the realities of a seriously disrupted U.S. economy brought it to an end . If you are losing sleep over volatility driven by a cascade of disheartening news , it may help to remember that the stock market is historically cyclical . There have been 10 bear markets ( prior to this one ) since 1950 , and the market has recovered eventually every time . Bear markets are typically defined as declines of 20 % or more from the most recent high , and bull markets are increases of 20 % or more from the bear market low . But there is no official declaration , so in some cases there are different interpretations regarding when these cycles begin and end . On average , bull markets lasted longer ( 1,955 days ) than bear markets ( 431 days ) over this period , and the average bull market advance ( 172.0 % ) was greater than the average bear market decline ( -34.2 % ) . The bottom line is that neither the ups nor the downs last forever , even if they feel as though they will . During the worst downturns , there were short - term rallies and buying opportunities . And in some cases , people have profited over time by investing carefully just when things seemed bleakest . Bear Markets Since 1950 August 1956 to October 1957 December 1961 to June 1962 February 1966 to October 1966 November 1968 to May 1970 January 1973 to October 1974 November 1980 to August 1982 August 1987 to December 1987 July 1990 to October 1990 March 2000 to October 2002 October 2007 to March 2009 87 929 517 " The intraday low marked a decline of -20.2 % , so this cycle is often considered a bear market . Calendar Days to Bottom 446 196 240 543 630 622 101 If you're reconsidering your current investment strategy , a volatile market is probably the worst time to turn your portfolio inside out . Dramatic price swings can magnify the impact of a wholesale restructuring if the timing of that move is a little off . A well - thought - out asset allocation and diversification strategy is still the fundamental basis of good investment planning . Changes in your portfolio don't necessarily need to happen all at once . Try not to let fear derail your long - term goals . Janney Montgomery Scott LLC is a memberi of the New York Stock Exchange , Financial Industry Regulatory Authority and the Securities Investor Protection Corporation . U.S. Stock Market Decline ( S & P 500 Index ) The return and principal value of stocks fluctuate with changes in market conditions . Shares , when sold , may be worth more or less than their original cost . Asset allocation and diversification are methods used to help manage investment risk ; they do not guarantee a profit or protect against investment loss . For more information about Janney , please see Janney's Relationship Summary ( Form CRS ) on www.janney.com/crs which details all material facts about the scope and terms of our relationship with you and any potential conflicts of interest . -21.5 % -28.0 % -22.2 % -36.1 % -48.2 % -27.1 % -33.5 % -19.9 % * -49.1 % -56.8 % The S & P 500 is an unmanaged group of securities that is considered to be representative of the U.S. stock market in general . The performance of an unmanaged index is not indicative of the performance of any specific investment . Individuals cannot invest directly in an index . Past performance is not a guarantee of future results . Actual results will vary . Source : Yahoo! Finance , 2020 ( data for the period 6/13/1949 to 3/12/2020 ) Prepared by Broadridge Advisor Solutions Copyright 2023 . In the photo , left to right : Wally Danforth ( VP / Wealth Management , Financial Advisor ) , Douglas W. Stirling ( EVP / Wealth Management . Financial Advisor ) , Joe Kennedy ( Financial Advisor ) Janney Montgomery Scott LLC Financial Advisors are available to discuss all considerations and risks involved with various products and strategies presented . We will be happy to provide a prospectus , when available , and other information upon request . Janney Montgomery Scott LLC , its affiliates , and its employees are not in the business of providing tax , regulatory , accounting , or legal advice . These materials and any tax - related statements are not intended or written to be used , and cannot be used or relied upon , by any taxpayer for the purpose of avoiding tax penalties . Any such taxpayer should seek advice based on the taxpayer's particular circumstances from an independent tax advisor . STIRLING WEALTH MANAGEMENT at Janney Montgomery Scott LLC Janney STIRLING WEALTH MANAGEMENT AT JANNEY MONTGOMERY SCOTT LLC 2200 Georgetowne Drive , Suite 400 , Sewickley , PA 15143 www.stirlingwealthmanagement.com 1 724.934.2953 in JANNEY MONTGOMERY SCOTT LLC MEMBER NYSE . FINRA SIPC REF 939050-0123 H